

act on climate
act on climate
A Democratic Non-Profit Community Organisation


Long Term Temperature and Rain Pattern for Port Macquarie (NSW)
Long Term Temperature and Rain Pattern for Port Macquarie (NSW)


Summary
Summary
Maximum Temperatures fell sharply from nearly 24 down to 22.8 from 1910 to 1935 and then started rising, up 1 degree to 23.8 so far, such that max temperatures are not higher than in 1910, though the last 3 years seem to show a sharp rise.
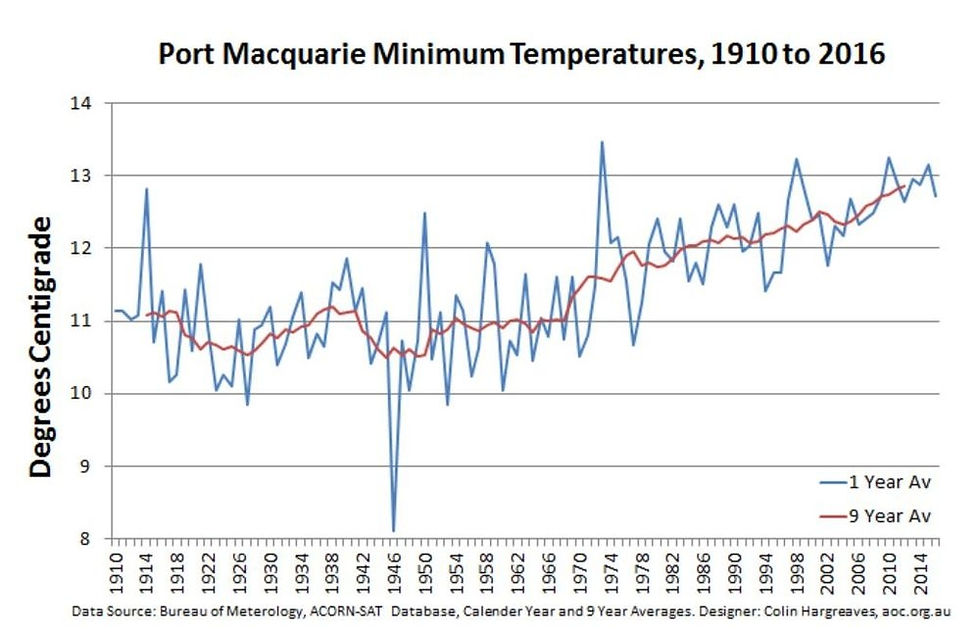
Minimum Temperatures were meanwhile fairly flat till the late 1960s and have since risen about 2 degrees to 12.8.
Diurnal Ranges, as a result, have fallen 2 degrees
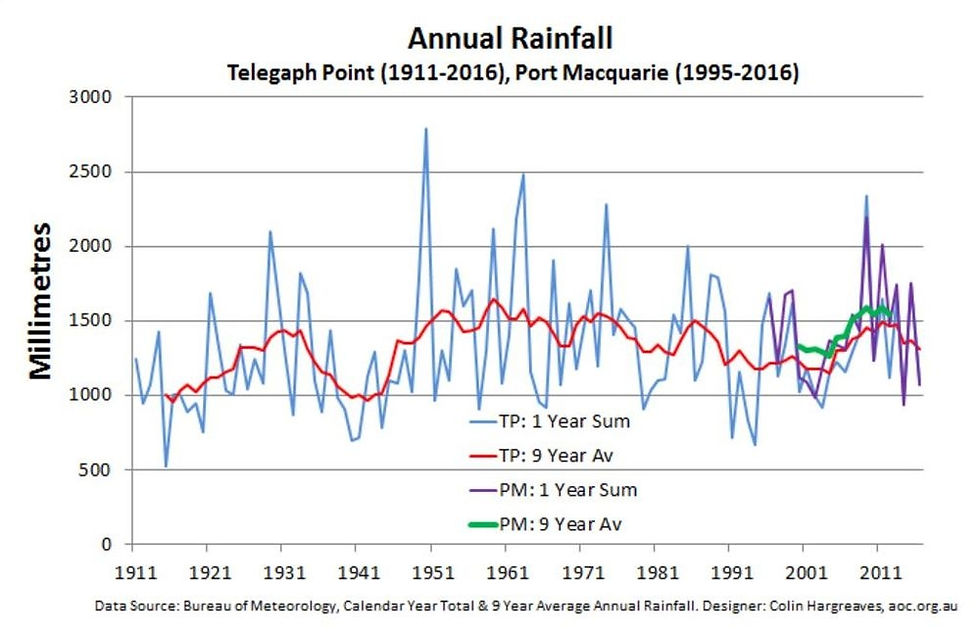
Rainfall data back to 1910 is only available for Telegraph Point: data for Port Macquarie goes back only to 1996. The graph includes both but they are very similar in pattern but Port Macquarie receives a little ore rain than telegraph Point. In the 1910s and 1940s the 9 year average fell to 1000mms while it has been up around 1300 to 1500mms since the 1950's. This pattern does now show the slight decline found often in South East Australia.